Better data drives better outcomes for children, youth, and families. The following graphs outline a trend for the time period of 2010-2011 to 2017-2018 for 5 service performance indicators from data collected through Ontario Children’s Aid Societies (CASs).
Safety
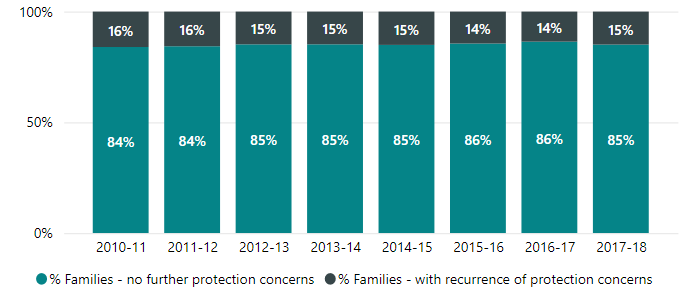
Recurrence of child protection concerns after an investigation case has closed
This performance indicator measures the percentage of families with closed child protection investigation cases in a fiscal year who were re-investigated within 12 months after case closing and child protection concerns were verified.
The majority of families (between 84 to 86 percent) do not have a recurrence of child protection concerns within 12 months of case closure in each of the eight years under review.
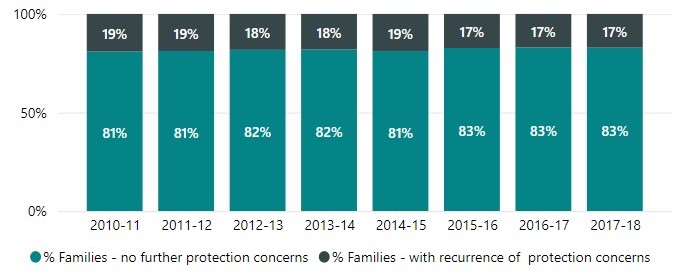
Recurrence of child protection concerns in a family after ongoing protection services were provided
This performance indicator measures the percentage of families with closed ongoing protection cases in a fiscal year that were reinvestigated with verified child protection concerns within 12 months following case closure.
The majority of families who received ongoing protection services (between 81 to 83 percent) did not return for service within 12 months of case closure in each of the eight years under review.
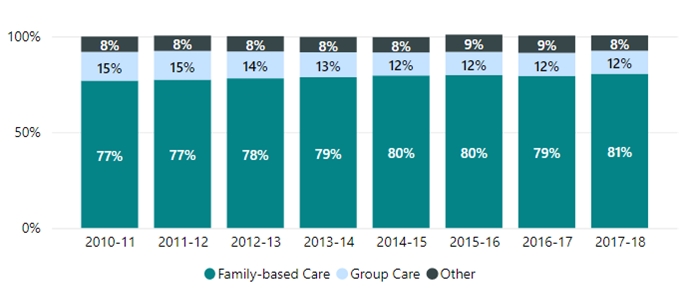
For all children and youth admitted to the care of a Children’s Aid Society, this indicator provides/measures (the percentage) of days of care provided in the fiscal year, by placement type (i.e., family-based care versus non-family-based care).
The majority of days of care provided are family based in each of the years under review.
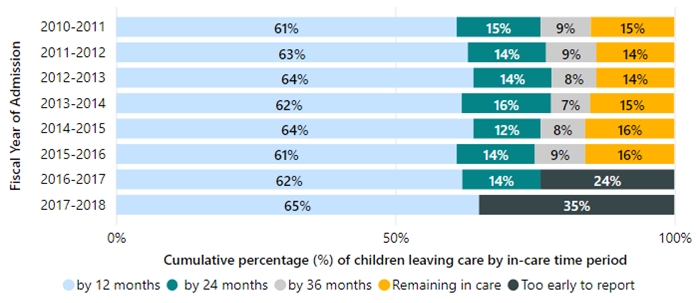
This performance indicator measures the cumulative percentage of children and youth who leave care within a specific time period since their year of admission to care (i.e. 12 months, 24 months and 36 months).
Over 60 percent of the children that come into care exit within 12 months of their admission.
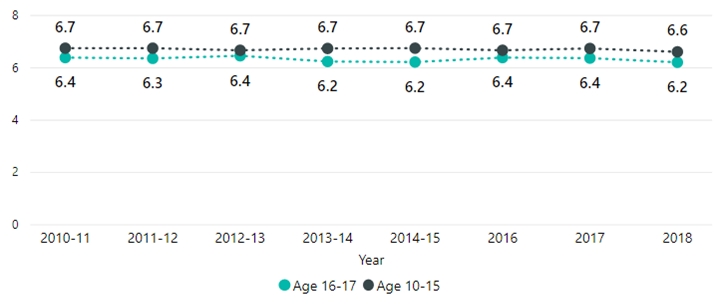
This performance indicator measures the average score for children in care (aged 10-17) from a standard scale that measures a young person’s perception of the quality of the relationship with his or her primary caregiver.
Children and youth in care between the ages of 10 to 17 have scored the quality of their relationship with their caregiver between 6.2 to 6.7 out of 8 over eight years.